
June 1, 2026

We might be living through the biggest financial hysteria ever.
For example, on April 24 the PHLX Semiconductor Sector (SOX) index closed higher for the 18th consecutive trading session. It’s the longest daily winning streak in the 32-year history of the index.
In 2014, SOX rose for 15 straight days, producing a gain of 7.8%. But during this April rally, the index rose 47%.
For perspective, the semiconductor index has annualized volatility of 30%-35%. So, the expected volatility over any 18-day period is roughly 1.2%-1.5%.
But a 47% gain in 18 days is more than four standard deviations away from the mean. In other words, that sort of performance is off the charts.
In a normal distribution, a four standard deviation event occurs less than 0.01% of the time. It would be about once every 40 to 50 years.
So, what we’re seeing isn’t normal. What comes next probably won’t be normal either.
On May 4 SOX reached an all-time high and then closed below its opening price. A daily reversal in overbought territory is a classic sign of a peak. On May 12, the index dropped 3%, though the Nasdaq Composite is still reaching new highs as of this writing.
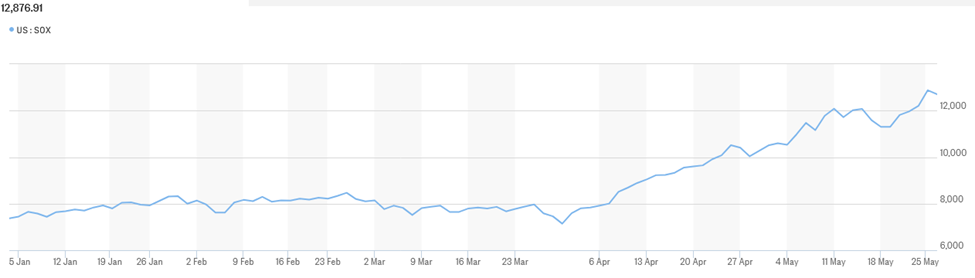
That divergence – leadership rolling over while the broad index extends – is not a bullish setup. This exact dynamic preceded March 2000.
Daniel A. White is an investment advisory representative of and provides advisory services through CoreCap Advisors, LLC. Daniel A. White & Associates and CoreCap Advisors are separate and unaffiliated entities.