
Monday, April 20, 2026

Unless you own a lot of energy stocks, the recent past has probably been bad news for your portfolio. Oil prices are higher and the energy sector, once again, has been the biggest gainer.
For instance, as of this writing the State Street Energy Select Sector SPDR Fund (XLE) is now up almost 40% for the year, far outpacing any other sector. The S&P 500 is now down 8% for the year.
Examining technical market indicators, for the first time since last spring and the rebound from the April 2025 tariff panic, the S&P 500 trades below its 200-day moving average (green line in the chart below). That’s the simple technical measure of the long-term trend.
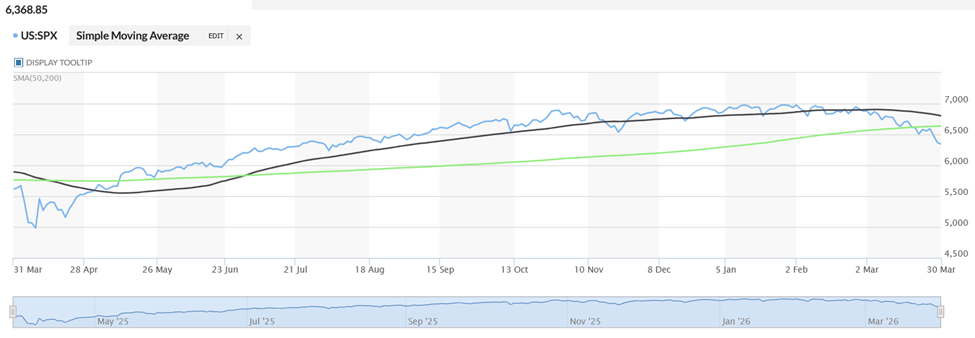
Things have been going downward for a bit, with the S&P 500 first falling below its shorter-term 50-day moving average (black line above) in January.
It’s a similar story for the Nasdaq Composite and the Dow Jones Industrial Average. Only the small-cap Russell 2000 remains above its 200-day moving average – and just barely.
These movements don’t guarantee anything about the future. But they provide signals about the general trends in the market and a good first look at strength or weakness.
The 200-day moving average is the big trend. If it’s rising, we know the market is up and we’ll want to own it.
Also, the 200-day moving average can act as resistance or support for price movements. It’s resistance when a stock rises up to it then turns lower and starts a new downturn. However, if the stock breaks through that resistance, the trend line typically becomes support.
So, we’re looking at U.S. stocks now breaking through support. Of course, one day does not make a trend. However, this has been the case for a while.
Daniel A. White is an investment advisory representative of and provides advisory services through CoreCap Advisors, LLC. Daniel A. White & Associates and CoreCap Advisors are separate and unaffiliated entities.